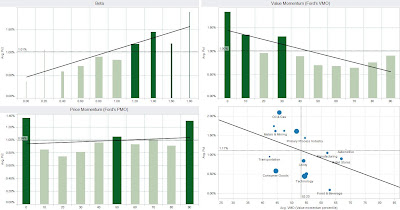
We've posted a workbook on Tableau Public that visualizes the performance of stock market. We update this through the trading day. You'll get a snapshot that highlights the best and worst performers. Check the time stamp to see when we last update
Click on this link to see interactive charts like the ones below but with current prices. Let us know what you think. We can help you set up similar reports customized to your portfolio.
 Below is the list of workbooks currently published on the server. Click to review each dashboard. They require Java. Questions? Call 917-751-1003


