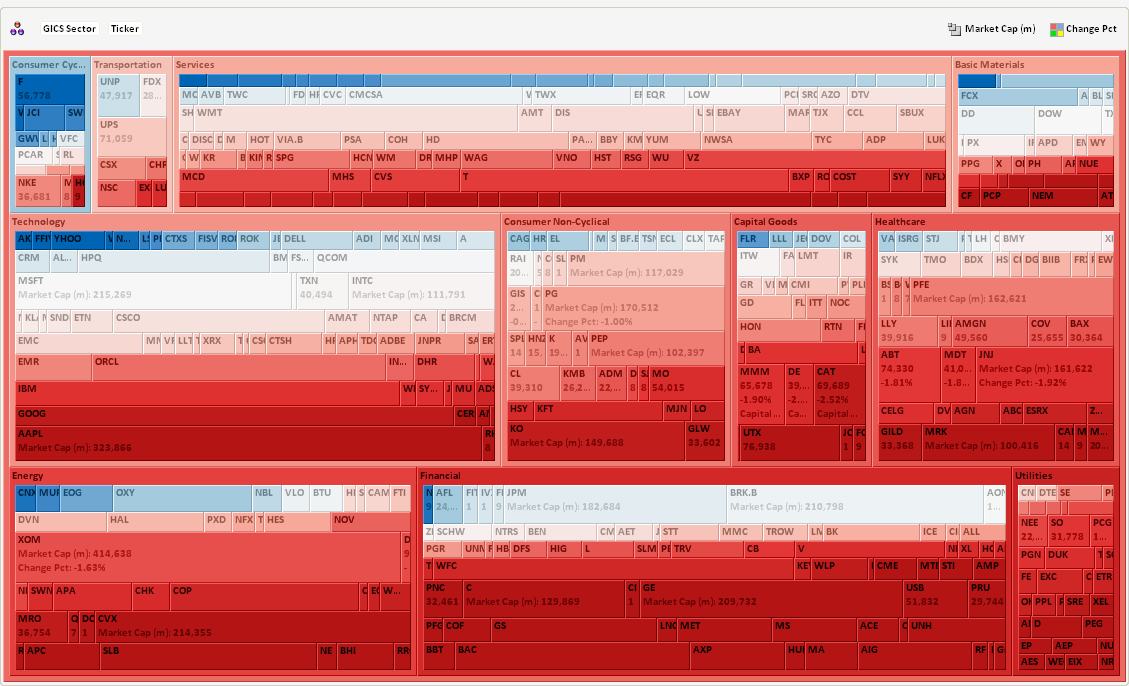
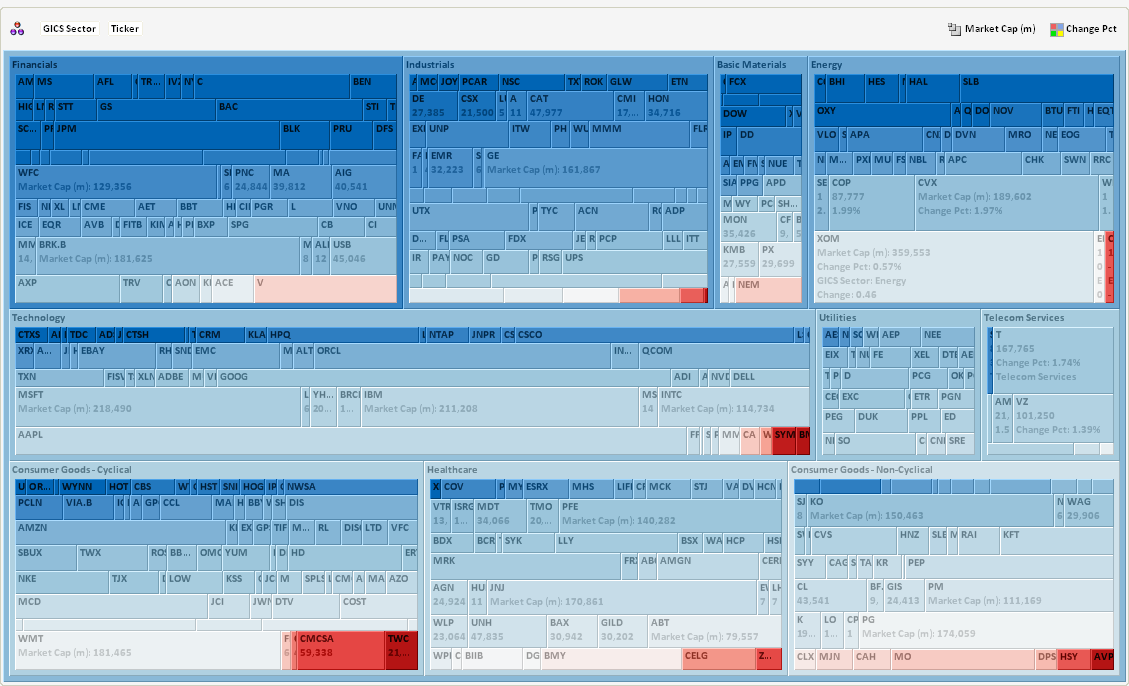
FRScalls demonstrates the power of visual analysis software combined with financial data. We have developed an innovative analytics engine for market and portfolio analysis with examples below.
Rail Traffic strong again this week. Back above 700K units with Canadian RRs CN and CP doing the best. Here are the Tableau vizs from our railfax.transmatch.com report. http://public.tableausoftware.com/views/NewRailshare/PctGroups?:embed=yes&:toolbar=yes&:tabs=yes
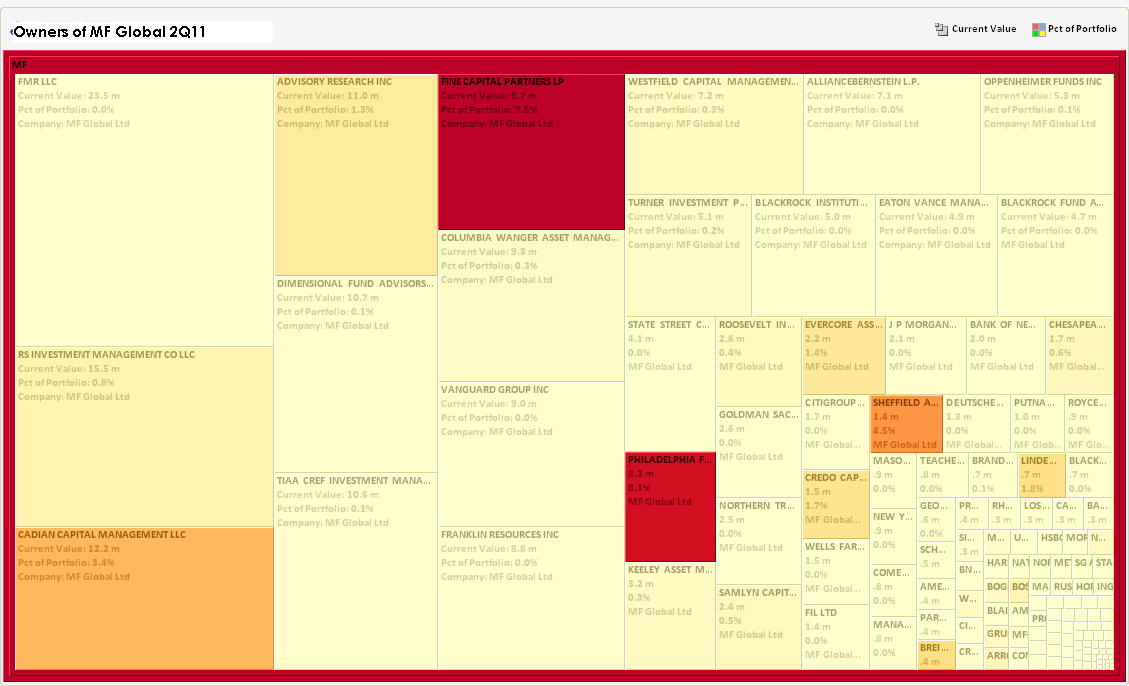
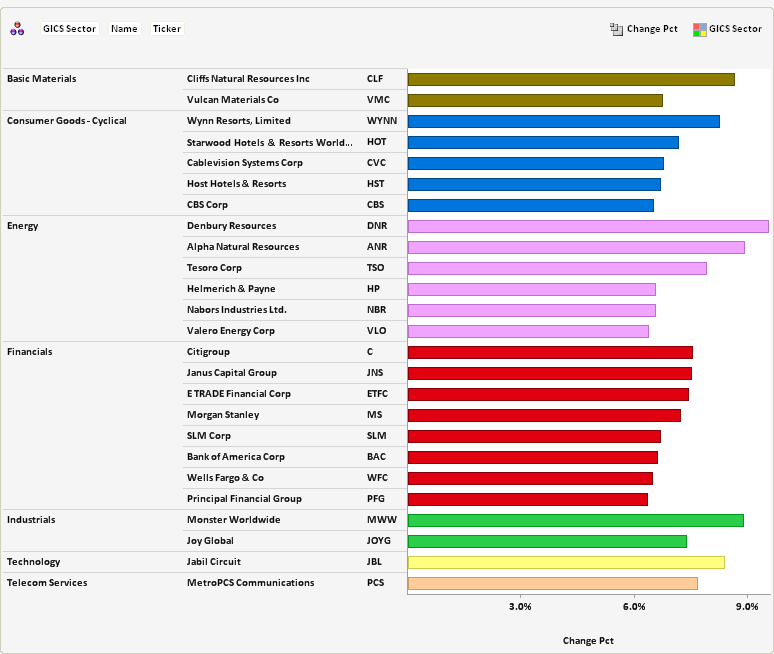
Sector Bets Name Bets Comparable Results since July 1 - Oct. 18 for 2Q11 13f filings. Of course someone had to sell these stocks and it was likely the hedge funds who owned them. As 3Q trickles in we'll do this again.
Would you like see how this is done? You can make visualizations like these for individual stocks, sectors and money managers with EzViz Portfolio. Download a one-month trial here.http://www.ezviz.biz/ezviz_trial.html
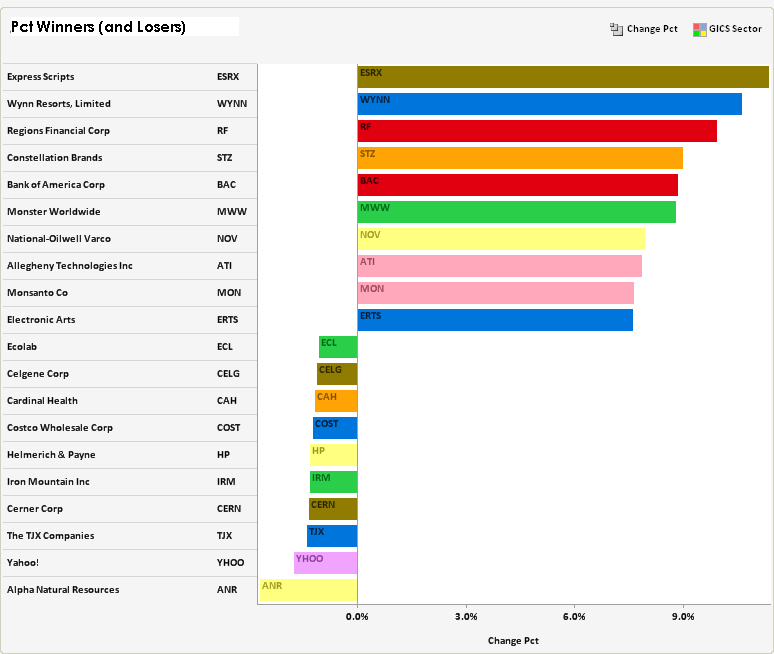
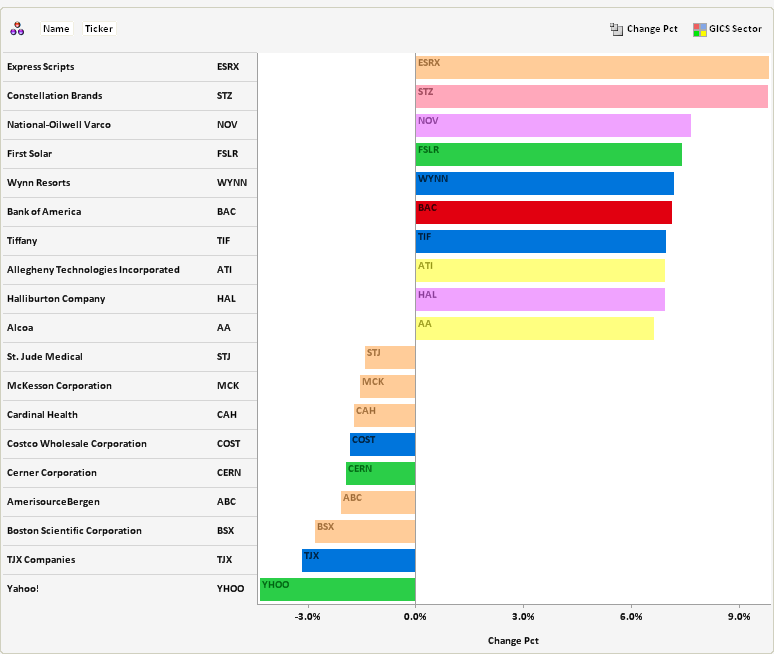
These are nice PNGs showing what happened in the market today. If you were a beta tester of our EzViz Portfolio platform you could have seen these pretty pictures ticking away on your screen in real time. And you could have put up your own portfolio. And you could have researched the big losers and later winners of the day from our 13f files. Want to beta test our visualization platform. Send us an email!
GTIV and AMED down big today on top of these losses since 2Q If you specialize in healthcare stocks do you sell out earlier? After all you are the experts. These funds are going to have some explaining to do.