30 November 2009

How can most fund managers underperform?


You'd think at least half of them would beat the SP500's 3.6% since Sept30 filing date for 13fs. To be fair some merger names fell out (WYE and SGP) and there are no doubt other flaws in these preliminary numbers but this should prompt a vigorous conversation between clients and their money managers. Don't you think?

Why REITs? Why now?


I am sure there is a good explanation for buying all the REITs but this blog is not about explanations; it's simply about showing you what we (and you) can do with the numbers in Financial Research Station. Behind the scenes we have REALLY jazzed up the 13f data base so we can tell you what all the hedge funds bought and sold in 3Q as well as focusing on each managers performance in Q3 and October. And because it's automated we can pull up a graphic report for any of 3000 managers in about 2 seconds. More to show later this week.
Also we've hooked streaming prices to our models so you can see charts like we have above ticking away during the day. Also we can add risk and valuation factors from Ford and Mergent to give some larger perspective to what's driving the market.

Which today was risk. High beta and low quality thy name is REIT.

Dubai no longer a factor for ETFs


What other conclusion could you draw when the REIT ETFs surge to the front of the pack. After all wasn't Dubai World just a Super-REIT?

China ends mixed after being mixed in the morning


China stocks did what they do best when US markets are confused. Hide out. Some interesting moves for riskier BB names in line with a bias towards risk with US names.

Most Stocks Down but they like risky ones


Rebound for Emerging Market ETFs. So far.

Say goodbye to China Cork


I have no patience for small OTCBB names that don't open at 9:30.

China stocks which were killed en masse on Friday showed mixed emotions this a with a few more stocks up than down but some big names taking water.

27 November 2009

Even the longest Black Friday lines were better than today's market


We are going to commercialize (also known as monetize) this extraordinary stock market application that combines realtime stock prices, Ford analytics, Tableau software before Xmas. So place your orders now at info@transmatch.com

More than you need to know about the market at 1130


Stuck in the suburbs without a car. Nothing to do but....

3Q 13f Summary - Winners and Losers


Finally got most of the 13f filings for the 3rd Quarter. More work to do on Monday when back in NYC. Here's a quick sort of the biggest winners and losers among institutional investors. Some of these big changes were because of new names for old funds eg Nomura. Some funds were going out of business. Some scooped up huge new accounts it looks like. The changes in stocks is shown just for the 13f filers so by no means complete but it should be directionally correct. A combination of capital gains and purchases.

Another look at the Tuesday before Dubai became a Turkey


Pretty neat a mon avis as we have it hooked into streaming prices now

Happy After Turkey Day

Dubai looks topical this morning. I may have some new things to show you after the open. Which will be down. This is from Tuesday. When I was driving down I95 and I85 and I40. I wondered why they sold off the banks. Someone knew something was going to happen yesterday. Lots of people knew.

24 November 2009

Everything you wanted to know about Tuesday's market


You should be able to see that they bought the market back from its lows but kept the bearish bias towards less risky names and assets. See you next week...Happy Turkey Day

Safe ETFs lead recovery

Everything you know is wrong or another ad for Financial Research Station

We've done this before. http://frscalls.blogspot.com/2009/10/advertisement-for-financial-research.html That was a straight copy from our website at frs.transmatch.com

This time let's show what FRS can do. Remember you have access to just about everything you will need for quantitative analysis of the stock market's movements since 1974. You have all Ford Equity variables for every member of the S&P500 when they were in the index. And most importantly the data are hardwired into Tableau software. That means anyone with ideas but lousy technical skills (e.g. me) can begin to test theories and measure performance in minutes.

First we'll look at Aug. 2007-Oct.2009. Lots happened. Maybe to much too comprehend. I heard a BarCap quant describing the period as one of constant regime change. I don't see that. Quite simply everything sold off at about equal speed until March of this year when they bought the junk (high beta low VMO). That trend stayed in place until October and now we are adrift. The biggest surprise was how unsafe you were with a safe portfolio in late 2008. The selling was indiscriminate. We also ran a backtest that showed that since forever it's been a better idea to own stocks that had gone up in the preceding year rather than ones that had gone down. Crude? Simplistic? Sure but that the strategy of buying price momentum worked over time. But not since March of this year as you can see. Also note that Ford's VMO indicator worked much better that plain old beta.


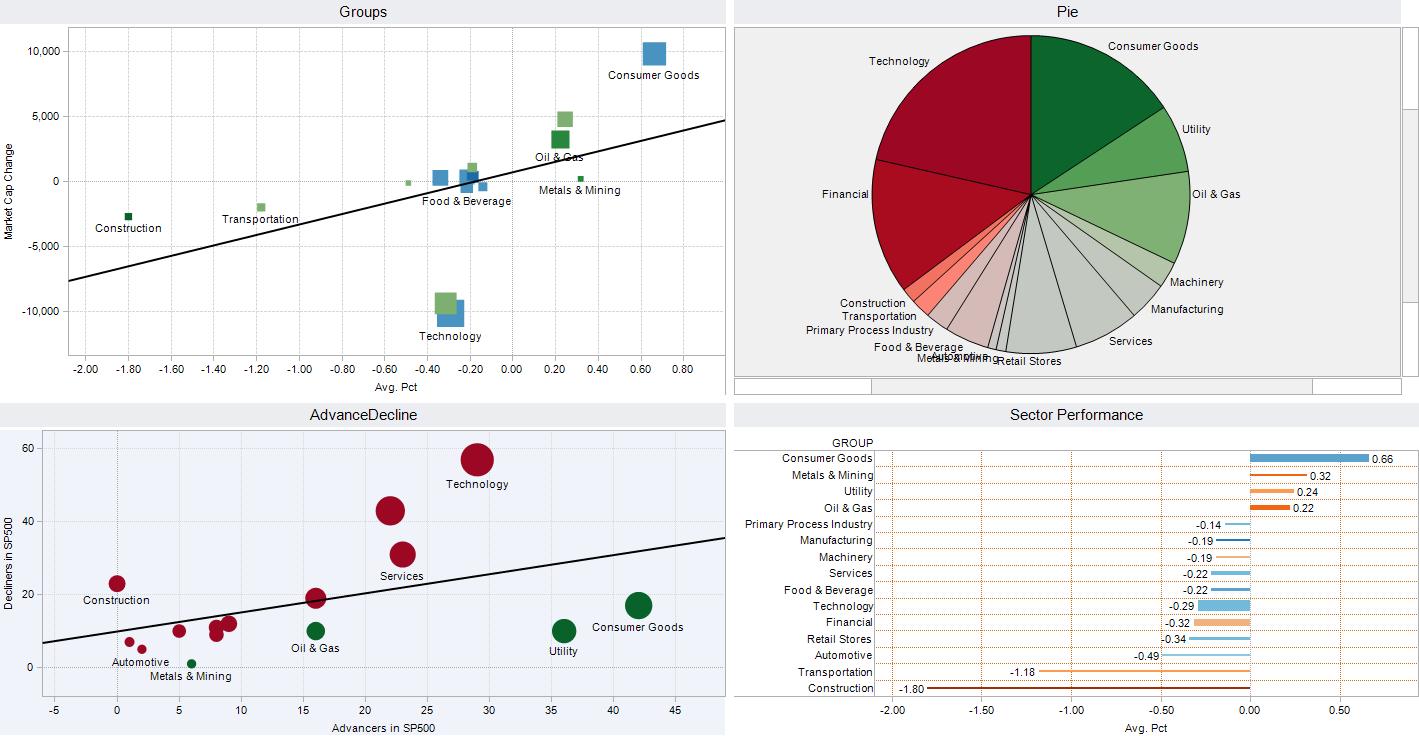
Now using the same model but with a slightly shorter time frame viz. October. Which was a bad month. High risk names measured any which way did not do well. High risk fund managers suffered the torments of the beta bear. Isn't it strange how all the "stockpickers" who did well this summer did poorly in October? You can see the best performing stocks as of 10/30 for the preceding three months. The colors indicate whether the stocks were high or low VMO (quality). With FRS you can visually analyze several variables in the same chart. Last you can see which industries did best or worst in October. The trend line says that no matter what you did if you had a high beta portfolio you were hurt.


Those are a few of the things I pulled from the FRS model this afternoon. Perhaps you can see a bias towards the way I look at the market. k. But you can do the same thing with FRS. Bring your own theory of the market and test it out. Value? Momentum? Earnings Surprise? Mean Reversion? Long-Short? You can test your biases in a blink with FRS. It's what you do when you find out that everything you know is wrong that will make the difference.

Risky ETFs Trail Market recovery

Bear for Thanksgiving Dinner?

not a dead bear cub. snoozing


Bearish start with flight from scary assets. VMO and Beta both putting up 80-110 bps bearish moves this AM. Bad morning for Techs and Homebuilders. I can forecast with certainty that all the action will be in the morning.

You don't need a weatherman to tell you it's Thanksgiving week


And a weak open for China stocks here in America. BB names which missed the fun yesterday morning are suffering a little less than Bigcaps. 138 stocks down for every 39 up.

Selling Riskier Assets

23 November 2009

UTES are the kings of the market


When utilities lead the way.....go away. Unfortunately my destination is the in-laws on Wednesday so no rush for me. Or the market it seems. Lots of liquidity flooded the market at the open and the rest of the day was spent neatening up and eliminating any market signals of real value or interest. We use Ford's VMO PMO EMO and their version of beta. No signal. No one is making big bets until December.

We put up a new table tonight to show how you can use FRS to screen, filter and sort your data base to get the info you need when you need it. That would be next Monday it looks like.